What you’re looking at
Combined Charts
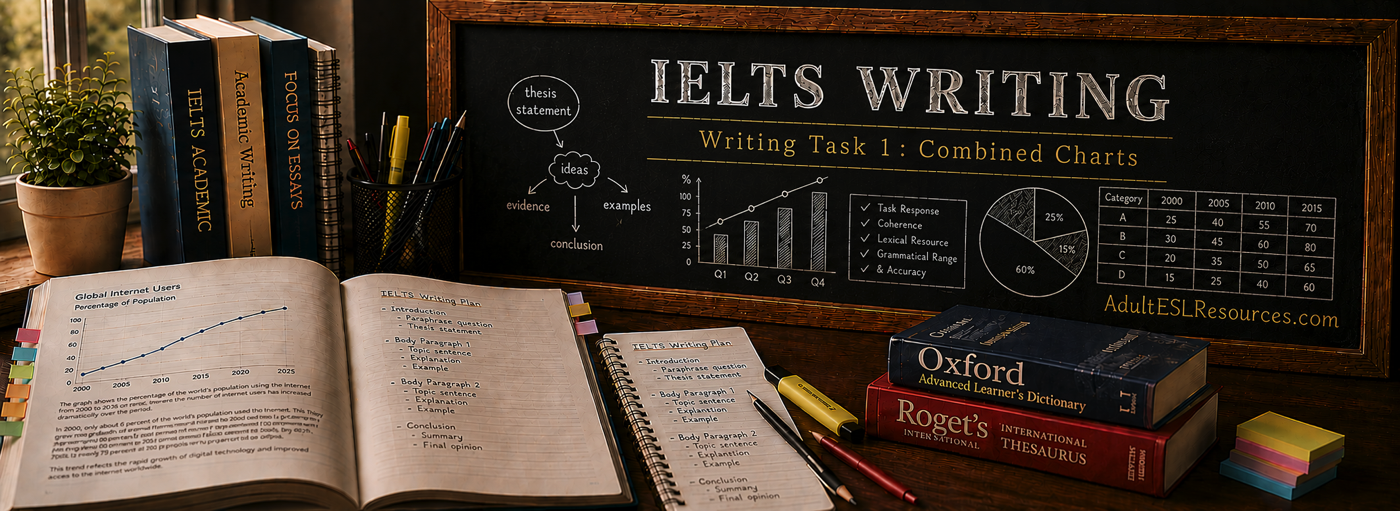
A combined-chart task presents two (or occasionally more) different visual types together — for example, a bar chart alongside a pie chart, or a table alongside a line graph. You are expected to describe both visuals in a single, connected answer.
The real challenge of combined charts isn’t analysing each visual individually — it’s deciding how the two visuals relate to each other and organising your answer so that relationship is clear.

How to analyse it
Reading combined visuals before you write
Identify each visual type first
Apply what you already know about each individual chart type before considering how they connect.
Look for a shared theme
The two visuals are almost always connected by a shared topic — figure out how one adds context to the other.
Decide which visual to lead with
Choose whichever visual contains the more significant overall feature to introduce first.
What you should look for
Features worth reporting
The Connection Between Visuals
If one visual explains or provides context for the other, say so directly rather than describing them as unrelated.
One Significant Feature From Each
Your overview should include at least one key feature from each visual, not just the one you find easier to describe.
Vocabulary & terminology
Language for connecting visuals
Introducing the pair
together, the visuals show…
“the chart and table together illustrate,” “the two visuals compare”
Linking information
this is reflected in / this corresponds to
“this pattern is reflected in the table below,” “this corresponds with the figures shown in the chart”
Transitioning
turning to the second visual…
“turning to the pie chart,” “the accompanying table shows a similar pattern”
Common mistakes
What costs candidates marks
Treating Them as Separate Answers
Writing two disconnected mini-answers instead of one integrated response with a shared overview.
Spending Too Long on One Visual
Over-describing the easier chart while giving the second visual only a single rushed sentence.
Missing the Overview Entirely
Jumping straight into describing each chart without ever stepping back to summarise the combined picture.
See it in practice
Example Task and Sample Answer
The example below is original and written for teaching purposes.
Example IELTS Task
The bar chart below shows total recycling rates in one city from 2015 to 2020, and the pie chart shows the breakdown of recycled materials in 2020.
Summarise the information by selecting and reporting the main features, and make comparisons where relevant.
Sample Answer
Sample Overview and Data Paragraph
The bar chart shows how total recycling rates in a city changed between 2015 and 2020, while the accompanying pie chart breaks down the types of material recycled in the final year.
Overall, the recycling rate increased considerably over the period shown, and paper made up the largest share of materials recycled by 2020.
According to the bar chart, the city’s recycling rate rose from around 20% in 2015 to approximately 45% in 2020, with the sharpest increase occurring between 2018 and 2019. This growth is reflected in the pie chart, which shows that paper accounted for 40% of all recycled material in 2020, followed by plastic at 28% and glass at 18%. The remaining materials, including metal and other items, made up the final 14% combined.
Why the Sample Works
One connected answer, not two separate ones
The sample explicitly connects the two visuals in its introduction and overview, then uses a transition phrase (“this growth is reflected in the pie chart”) to move between them, rather than treating them as unrelated tasks. Both visuals receive a proportionate amount of detail.
Ready for the next step?
Review the framework behind every Task 1 answer.
You’ve now covered every Task 1 visual type. Revisit the overview-and-data structure that ties them all together, or move on to Task 2.
Structuring Your Answer
Review the overview-and-data framework that applies to every Task 1 visual.