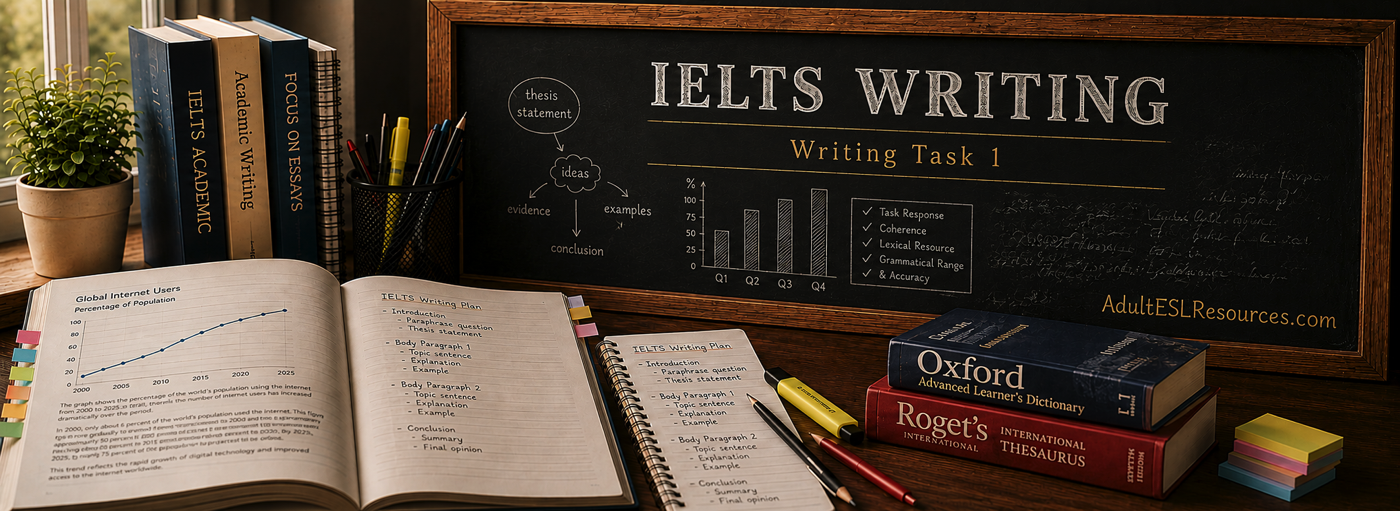
Welcome to Task 1
Report what the data shows — nothing more.
IELTS Writing Task 1 asks you to describe visual information objectively in at least 150 words. It is not an essay, and it does not ask for your opinion. Your only job is to identify and report the significant features of the visual accurately and clearly.
The visual you receive could be a bar chart, line graph, pie chart, table, map, process diagram, or a combination of more than one visual. Each type requires a slightly different analysis method and vocabulary, which is why this section teaches each one separately.
Once you understand how to analyse the specific visual in front of you, the overall structure of a strong Task 1 answer stays largely the same.

Know your visual
Seven visual types, one task
Task 1 always presents a visual to describe — a bar chart, line graph, pie chart, table, map, process diagram, or a combination of more than one.
Two skills, always
Analysis changes. Structure doesn’t.
However different the seven visual types look, every strong Task 1 answer is built from the same two skills: accurately analysing what’s in front of you, and organising that analysis into a clear, well-structured response.
Changes by visual
Analysis & Vocabulary
How you read the visual and the language you use to describe it depends entirely on the visual type — that’s why each type has its own page.
Stays the same
Overall Structure
The paragraph structure of your answer — an overview followed by supporting data — applies no matter which visual you’re given.
Next step
Learn the structure every Task 1 answer follows.
Once you’re comfortable analysing your specific visual type, learn how to organise that analysis into a clear, well-structured Task 1 answer.